Clarifications on allowability of expenditure under section 37 (Budget 2022)

Section 37 of the Act provides for allowability of revenue and non-personal expenditure (other than those failing under sections 30 to 36) laid out or expended wholly and exclusively for the purposes of business or profession.

Explanation 1 of sub section (1) of section 37 of the Act provides that if any expenditure incurred by an assessee for any purpose which is an offence or which is prohibited by law shall not be deemed to have been incurred for the purpose of business or profession and no deduction or allowance shall be made in respect of such expenditure.

However, it is s een that certain taxpayers are claiming deductions on expenditure incurred in offering certain benefits or perquisite to a person which are not intended to be allowed under this section, like meeting his expenditure related to travel, hospitality, conferen ce etc. In perquisite by these cases acceptance of such benefit or such person is in violation of a law or rule or regulation or guidelines, as the case may be, governing the conduct of such person.

In order to make the intention of the legislation clear and to make it free from any misinterpretation, it is proposed to insert another Explanation 3 to subsection (1) of section 37 to further clarify that the expression “expenditure incurred by an assessee for any purpose which is an offence or which is prohibited by law”, under Explanation 1, shall include and shall be deemed to have always included the expenditure incurred by an assessee, —

i. for any purpose which is an offence under, or which is prohibited by, any law for the time being in force, in India or outside India; or

ii. to provide any benefit or perquisite, in whatever form, to a person, whether or not carrying on a business or exercising a profession, and acceptance of such benefit or perquisite by such person is in violation of any law or rule or regulation or guidelines, as the case may be, for the time being in force, governing the conduct of such person; or

iii. to compound an offence under any law for the time being in force, in India or outside India.

BUDGET 2022 (Download all budget documents) -01st Feb 2022)

Key to Budget Document, 2022

https://www.indiabudget.gov.in/doc/Key_to_Budget_Document_2021.pdf

Budget Highlights (Key Features)

https://www.indiabudget.gov.in/doc/bh1.pdf

Annual Financial Statement
+

https://www.indiabudget.gov.in/#collapse2

Memorandum Explaining the Provisions in the Financial Bill

https://www.indiabudget.gov.in/doc/memo.pdf

Finance Bill

https://www.indiabudget.gov.in/doc/Finance_Bill.pdf

Statements of Fiscal Policy under the FRBM Act, 2003

https://www.indiabudget.gov.in/doc/frbm1.pdf

Output Outcome Framework for Schemes 2022-2023

https://www.indiabudget.gov.in/doc/OutcomeBudgetE2021_2022.pdf

Customs Notifications
+

https://www.indiabudget.gov.in/#custom

Implementation of Budget Announcements 2021-2022

https://www.indiabudget.gov.in/doc/impbud2020-21.pdf

Budget at a Glance
+

https://www.indiabudget.gov.in/#budget

Expenditure Profile
+

https://www.indiabudget.gov.in/#expen

Expenditure Budget

https://www.indiabudget.gov.in/#expenb

Ministry wise Summary of Budget Provisions

https://www.indiabudget.gov.in/doc/eb/sumsbe.pdf

All Statements of Budget Estimates

https://www.indiabudget.gov.in/doc/eb/allsbe.pdf

Finance Minister’s Speech

https://www.indiabudget.gov.in/#collapse1

Initiatives under AatmaNirbhar Bharat including structural and procedural reforms reinforce performance of the industrial sector, expected to grow by 11.8 percent in this financial year (Press release-31st Jan 2022)

Initiatives under AatmaNirbhar Bharat including structural and procedural reforms reinforce performance of the industrial sector, expected to grow by 11.8 percent in this financial year


Investor friendly FDI policy sets up new records in FDI inflows registering highest ever annual FDI inflow of 81.97 billion US$ in 2020-21

Gross bank credit to the industrial sector records growth of 4.1 percent

Production Link Incentive scheme (PLI) Scheme reduces transaction costs, improves ease of doing business

National Infrastructure Pipeline (NIP), National Monetization Plan (NMP) propel infrastructure investment

UDYAM Registration Portal and revision in the definition of the MSMEs enhance productivity, facilitating expansion and growth

Setting up of seven PM Mega Integrated Textiles Region and Apparel Parks (MITRA) notified with a total outlay of Rs. 4,445 crore

Government approves outlay of Rs. 76,000 crore for the development of semiconductors and display manufacturing ecosystem

Construction of National Highways/roads registers an increase of 30.2 percent over the previous year

1835 track km per year of new track length added by Indian Railways through new-lines and multi-tracking projects

Lakshya Bharat Portal launched to provide clear demand projections by oil and gas organizations

Ujjwala 2.0 launched to provide additional 1 crore LPG connections

Government liberalizes drone rules, revises PLI Scheme for growth in aviation sector

Maritime India Vision 2030, envisages coordinated and accelerated growth of India’s maritime sector, 100 years old Inland Vessel Act 1917 replaced with Inland Vessel Act 2021 ushering in a new era

Telecom Reforms to boost 4G proliferation, infuse liquidity and create an enabling environment for investment in 5G networks

India witness fastest rate of growth in renewable energy capacity growing by 2.9 times and solar energy expanding by over 18 times, Green Energy Corridor Projects initiated

Initiatives under AatmaNirbhar Bharat including structural and procedural reforms reinforce performance of the industrial sector, expected to grow by 11.8 perce

https://pib.gov.in/PressReleaseIframePage.aspx?PRID=1793805&RegID=3&LID=1

WITH REVIVAL OF ECONOMY, EMPLOYMENT INDICATORS BOUNCED BACK TO PRE-PANDEMIC LEVELS DURING LAST QUARTER OF 2020-21

WITH REVIVAL OF ECONOMY, EMPLOYMENT INDICATORS BOUNCED BACK TO PRE-PANDEMIC LEVELS DURING LAST QUARTER OF 2020-21


MONTHLY NET ADDITION IN EPF SUBSCRIPTIONS DURING 2021 SURPASS LEVELS OF CORRESPONDING MONTHS OF PRE-PANDEMIC YEAR 2019

DEMAND FOR MGNREGS WORK STABILIZES AFTER SECOND COVID SURGE BUT REMAINS HIGHER THAN PRE-PANDEMIC LEVEL

3 TIMES MORE ADDITIONAL WORKFORCE CREATED BETWEEN 2018-19 & 2019-20 AS COMPARED TO THE PREVIOUS PERIOD (2017-18 & 2018-19)

FEMALE WORKFORCE CONTRIBUTED TO 63 PERCENT OF ADDITIONAL WORKFORCE CREATED DURING 2018-19 AND 2019-20

The various indicators of employment have bounced back remarkably, after showing a decline during the first quarter of 2020-21, during the nationwide lockdown due to Covid pandemic. The Economic Survey 2021-22 which was tabled in the Parliament today by the Union Minister for Finance & Corporate Affairs, Smt Nirmala Sitharaman has analysed trends in labour market and the impact of Covid-19 on employment.

Trends in Urban Labour Market:

The Survey states that with the revival of the economy, the Unemployment Rate (UR), the Labour Force Participation Rate (LFPR) and the Worker Population Rate (WPR) almost reached their pre-pandemic levels during the last quarter of 2020-21 as per Periodic Labour Force Survey Data.

The Economic Survey also analyses trends in urban employment using Employees Provident Funds Organization (EPFO) payroll data. An analysis of the EPFO data suggests significant acceleration in formalization of the job market, during 2021. In fact, in November, 2021, the monthly net additional EPF subscription peaked with 13.95 lakh new subscribers, the highest in any given month since 2017, the Survey states. This translates into growth of 109.21 percent in EPF subscription from November, 2020. The Economic Survey further states that the monthly net addition in EPF subscriptions during 2021 has not only been higher than the corresponding monthly values in 2020 but they have also surpassed the levels of the corresponding months during pre-pandemic year 2019. 

Trends in Rural Labour Market:

            Economic Survey 2021-22 analyses trends in Rural Labour Market with the help of latest data on demand for work under Mahatma Gandhi National Rural Employment Guarantee Scheme (MGNREGS).

            The Survey observes that the MGNREGS employment peaked during the nationwide lockdown in 2020. However an interesting trend was observed for many migrant source states like West Bengal, Madhya Pradesh, Odisha, Bihar, in which the MGNREGS employment in most months of 2021 has been lower than the corresponding level in 2020. In contrast, the demand for MGNREGS employment has been higher for migrant recipient states like Punjab, Maharashtra, Karnataka and Tamil Nadu for most months in 2021 over 2020.

Giving further details, the Economic Survey points out that the demand for MGNREGS work has stabilized after the second Covid wave. It further states that the aggregate MGNREGS employment is still higher than pre-pandemic level. During the second Covid wave, demand for MGNREGS employment reached the maximum level of 4.59 crore persons in June 2021.

Long Term Trends in Employment using Annual PLFS Data:

            During PLFS 2019-20 (survey period from July 2019 to June 2020), employment at usual status continued to expand. Between 2018-19 and 2019-20, about 4.75 crore additional persons joined the workforce. This is about three times more than the employment created between 2017-18 and 2018-19. The rural sector contributed much more to this expansion relative to the urban sector (3.45 crore in rural sector and 1.30 crore in urban sector). Further, amongst the additional workers, 2.99 crore were females (63 percent). About 65 percent of the additional workers joined in 2019-20 were self employed. About 75 percent of the female workers who joined as self- employed were ‘unpaid family labour’. About 18 percent of the additional workers were Casual Labourer and 17 percent were ‘Regular Wage/Salaried Employee’. Further, the number of unemployed persons in 2019-20 has also decreased by 23 lakhs, constituted largely by males from the rural sector.

            With respect to industry wise employment in India, of the workers added in 2019-20, more than 71 percent were in agricultural sector. Among the new workers in the agriculture sector, females account for about 65 percent. Trade, hotel and restaurant sector accounted for a little over 22 percent of the new workers, in line with previous year’s trend where the sector represented more than 28 percent of the new workers. The share of manufacturing has declined from 5.65 percent of new workers added in 2018-19 to about 2.41 percent of new workers added in 2019-20, and so has that of construction from 26.26 percent to 7.36 percent.

Important Policy Measures to boost livelihoods:

The Economic Survey has highlighted several policy responses to boost livelihoods. These include Aatmanirbhar Bharat Rojgaar Yojana which was announced as a part of Aatmanirbhar 3.0 package to boost the economy, increase the employment generation in post Covid recovery phase and to incentivise creation of new employment alongwith the social security benefits and restoration of loss of employment during Covid-19 pandemic.

To boost employment and livelihood for returnee migrant workers, Garib Kalyan Rojgar Abhiyan was launched in June 2020. It focused on 25 target driven works to provide employment and create infrastructure in the rural areas of 116 districts 6 states with  resource envelope of Rs.50,000 Crore.

Similarly, allocation to MGNREGS in FY 2021-22 increased to Rs. 73,000 crore, from Rs. 61,500 crore in FY 2020-21. Allocation for FY 2021-22 has been enhanced to Rs.98000 crore so far. In FY 2021-22 over 8.70 crore individuals and 6.10 crore households were provided work so far.


The Survey also highlights several other social protection measures which have been stepped up like Pradhan Mantri Shramyogi Mandhan (PM-SYM) Yojana, National Pension Scheme for traders/shopkeepers/self employed persons, e-SHRAM portal to facilitate delivery of Social Security Schemes to workers and Labour Reforms for welfare of labour.

CENTRAL THEME OF ECONOMIC SURVEY 2021-22 IS THE “AGILE APPROACH” (Press Release 31 Jan 2022)

CENTRAL THEME OF ECONOMIC SURVEY 2021-22 IS THE “AGILE APPROACH”


PREFACE TAKES A BIRD’S EYE VIEW OF EVOLUTION OF ECONOMIC SURVEYS SINCE INDEPENDENCE

NEW CHAPTER DEMONSTRATES USE OF SATELLITE & GEO-SPATIAL IMAGES TO GAUGE VARIOUS ECONOMIC PHENOMENON

ECONOMIC SURVEY REVERTS TO A SINGLE VOLUME PLUS A SEPARATE VOLUME FOR STATISTICAL APPENDIX

The central theme of this year’s Economic Survey is the “Agile approach”, implemented through India’s economic response to the COVID-19 Pandemic shock. Informing further, the preface of Economic Survey states that the “Agile approach” is based on feed-back loops, real-time monitoring of actual outcomes, flexible responses, safety-net buffers and so on.

The Economic Survey 2021-22 tabled by the Union Minister for Finance & Corporate Affairs Smt. Nirmala Sitharaman in the Parliament today, argues that some form of feedback loop based policy-making was always possible, but the “Agile framework: is particularly relevant today because of the explosion of real-time data that allows for constant monitoring. Such information includes GST collections, digital payments, satellite photographs, electricity production, cargo movements, internal/external trade, infrastructure roll-out, delivery of various schemes, mobility indicators, to name just a few. Some of them are available from public platforms but many innovative forms of data are now being generated by the private sector. Short-term policy responses, therefore, the Survey states, can be tailored to an evolving situation rather than what a model may have predicted.

 Planning matters in this framework but mostly for scenario-analysis, identifying vulnerable sections, and understanding policy options rather than as a deterministic prediction of the flow of events. The Survey notes that the previous Economic Survey did briefly discuss this approach but it is a central theme for this Survey.

Another theme highlighted in this Economic Survey relates to the art and science of policy-making under conditions of extreme uncertainty. It is not just about the immediate disruptions and uncertainty caused by repeated waves of the COVID-19 pandemic, but also the longer-term uncertainty about the post-COVID world due to accelerated shifts in technology, consumer behaviour, supply-chains, geo-politics, climate change and a host of other factors. Not only are these individual factors difficult to forecast, the impact of their interactions are fundamentally unpredictable. The same recognition of uncertainty informs the longer-term supply-side strategy: the combination of policies that encourage economic flexibility through innovation, entrepreneurship and risk-taking on one hand, and simultaneously invests in resilient infrastructure, social safety-nets and macro-economic buffers on the other.

The Survey states that various policies of the Government of India are all about protection from or taking advantage of an uncertain future.  It expects its readers to recognise the links between seemingly disparate policies ranging from deregulation, process simplification, privatization, foreign exchange reserves accumulation, inflation-targeting, housing-for-all, green technology, the Insolvency and Bankruptcy Code, health insurance for the poor, financial inclusion, infrastructure spending, direct benefit transfers and so on.

The Preface also takes a bird’s eye view of the “great deal of evolution” of the Economic Surveys presented since the first Survey in 1950-51. The Survey charted out many permutations and combinations in terms of language, statistics, formats, topics, length, scope and prescriptions projected through the Economic Surveys. Interestingly, for more than a decade after 1st Survey, the Survey document was clubbed with the Union Budget.

Making a shift from the two-volume format of recent years to a single volume plus a separate volume for statistical tables, the Survey argues for smaller and terse document. Over the years, increasing voluminous state of the document has made it unwieldy with last year’s Economic Survey 2020-21 with almost 900 pages. Therefore, this year’s Survey reverts to a single volume plus a separate volume for the Statistical Appendix. The idea of having a separate volume for the statistical appendix is to give it a distinct identity as the one-stop source of authentic data. The Economic Survey hopes that it will evolve in the next few years to include new kinds of socio-economic data in line with the emphasis on a feedback loop approach.

Along with the sectoral chapters, this year’s Survey adds a new chapter that demonstrates the use of satellite and geo-spatial images to gauge various economic phenomenon – urbanisation, infrastructure, environmental impact, farming practices and so on.

Monthly Review of Accounts of Union Government of India upto month of December 2021 for Financial Year 2021-22

The Monthly Account of the Union Government of India upto the month of December, 2021 has been consolidated and reports published. The highlights are given below:-

The Government of India has received Rs. 17,61,692 crore (89.1% of corresponding BE 2021-22 of Total Receipts) upto December, 2021 comprising Rs. 14,73,809 crore Tax Revenue (Net to Centre), Rs. 2,59,414 crore of Non-Tax Revenue and Rs. 28,469 crore of Non Debt Capital Receipts. Non-Debt Capital Receipts consists of Recovery of Loans Rs. 19,105 crore and Miscellaneous Capital Receipts of Rs. 9,364 crore. Rs. 4,50,310 crore has been transferred to State Governments as Devolution of Share of Taxes by Government of India upto December, 2021. 

Total Expenditure incurred by Government of India is Rs. 25,21,058 crore (72.4% of corresponding BE 2021-22), out of which Rs. 21,29,414 crore is on Revenue Account and Rs. 3,91,644 crore is on Capital Account. Out of the Total Revenue Expenditure, Rs. 5,64,414 crore is on account of Interest Payments and Rs. 2,71,374 crore is on account of Major Subsidies.

Press Release dated 31st Jan 2022

KEY HIGHLIGHTS OF THE ECONOMIC SURVEY 2021-22 (Press release dated 31 Jan 2022)

9.2 PERCENT GROWTH EXPECTED IN REAL TERMS IN 2021-22

GDP PROJECTED TO GROW 8.0-8.5 PERCENT IN 2022-23

PANDEMIC: GOVERNMENT’s SUPPLY SIDE REFORMS PREPARING ECONOMY FOR SUSTAINED LONGTERM EXPANSION 

CAPEX GROWS BY 13.5 PERCENT (YoY) DURING APRIL-NOVEMBER, 2021

FOREIGN EXCHANGE RESERVES TOUCH  US$ 633.6 BILLION ON 31st DECEMBER, 2021 

MACROECONOMIC STABILITY INDICATORS SUGGEST ECONOMY WELL PLACED TO TAKE ON CHALLENGES OF 2022-23
MASSIVE GROWTH IN REVENUE RECEIPTS

SOCIAL SECTOR: EXPENDITURE ON SOCIAL SERVICES AS PROPORTION OF GDP INCREASES TO 8.6 PERCENT IN 2021-22 (BE) AS COMPARED TO 6.2 PERCENT IN 2014-15 

WITH REVIVAL OF ECONOMY, EMPLOYMENT INDICATORS BOUNCED BACK TO PRE-PANDEMIC LEVELS DURING LAST QUARTER OF 2020-21

MERCHANDISE EXPORTS AND IMPORTS REBOUND STRONGLY AND SURPASS PRECOVID LEVELS 

BANK CREDIT ACCELERATES TO 9.2 PERCENT AS ON 31st DECEMBER, 2021

Rs 89,066 CRORE RAISED VIA 75 IPOs; SIGNIFICANTLY HIGHER THAN IN ANY YEAR IN LAST DECADE

CPI-C INFLATION MODERATES TO 5.2 PERCENT IN 2021-22 (APRIL-DECEMBER)

FOOD INFLATION AVERAGES AT A LOW OF 2.9 PERCENT IN 2021-22 (APRIL-DECEMBER)

EFFECTIVE SUPPLY SIDE MANAGEMENT KEEPS PRICES OF MOST ESSENTIAL COMMODITIES UNDER CONTROL

AGRICULTURE: GVA REGISTERS BUOYANT GROWTH OF 3.9% IN 2021-22

RAILWAYS: CAPITAL EXPENDITURE SEES SUBSTANTIAL INCREASE TO Rs. 155,181 CRORE IN 2020-21; BUDGETED TO FURTHER INCREASE TO Rs. 215,058 CRORE IN 2021-22, A FIVE TIMES INCREASE COMPARED TO 2014 LEVEL 

PER DAY ROAD CONSTRUCTION INCREASES TO 36.5 KMS IN 2020-21 – RISE OF 30.4 PERCENT COMPARED TO THE PREVIOUS YEAR

SDGs: OVERALL SCRORE ON NITI AAYOG DASHBOARD IMPROVES TO 66 IN  2020-21

The Union Minister for Finance & Corporate Affairs, Smt. Nirmala Sitharaman presented the Economic Survey 2021-22 in Parliament today. The highlights of the Economic Survey are as follows:

State of the Economy:

  • Indian economy estimated to grow by 9.2 percent in real terms in 2021-22 (as per first advanced estimates) subsequent to a contraction of 7.3 percent in 2020-21. 
  • GDP projected to grow by 8- 8.5 percent in real terms in 2022-23.  
  • The year ahead poised for a pickup in private sector investment with the financial system in good position to provide support for economy’s revival. 
  • Projection comparable with World Bank and Asian Development Bank’s latest forecasts of real GDP growth of 8.7 percent and 7.5 percent respectively for 2022-23.
  • As per IMF’s latest World Economic Outlook projections, India’s real GDP projected to grow at 9 percent in 2021-22 and 2022-23 and at 7.1 percent in 2023-2024, which would make India the fastest growing major economy in the world for all 3years.
  • Agriculture and allied sectors expected to grow by 3.9 percent; industry by 11.8 percent and services sector by 8.2 percent in 2021-22.
  • On demand side, consumption estimated to grow by 7.0 percent, Gross Fixed Capital Formation (GFCF) by 15 percent, exports by 16.5 percent and imports by 29.4 percent in 2021-22.
  • Macroeconomic stability indicators suggest that the Indian Economy is well placed to take on the challenges of 2022-23.
  • Combination of high foreign exchange reserves, sustained foreign direct investment, and rising export earnings will provide adequate buffer against possible global liquidity tapering in 2022-23.
  • Economic impact of “second wave” was much smaller than that during the full lockdown phase in 2020-21, though health impact was more severe.
  • Government of India’s unique response comprised of safety-nets to cushion the impact on vulnerable sections of society and the business sector, significant increase in capital expenditure to spur growth and supply side reforms for a sustained long-term expansion.
  • Government’s flexible and multi-layered response is partly based on an “Agile” framework that uses feedback-loops, and the use of eighty High Frequency Indicators (HFIs) in an environment of extreme uncertainty.

Fiscal Developments:

  • The revenue receipts from the Central Government (April to November, 2021) have gone up by 67.2 percent (YoY) as against an expected growth of 9.6 percent in the 2021-22 Budget Estimates (over 2020-21 Provisional Actuals).
  • Gross Tax Revenue registers a growth of over 50 percent during April to November, 2021 in YoY terms.  This performance is strong compared to pre-pandemic levels of 2019-2020 also. 
  • During April-November 2021, Capex has grown by 13.5 percent (YoY) with focus on infrastructure-intensive sectors.
  • Sustained revenue collection and a targeted expenditure policy has contained the fiscal deficit for April to November, 2021 at 46.2 percent of BE.
  • With the enhanced borrowings on account of COVID-19, the Central Government debt has gone up from 49.1 percent of GDP in 2019-20 to 59.3 percent of GDP in 2020-21, but is expected to follow a declining trajectory with the recovery of the economy. 

External Sectors:

  • India’s merchandise exports and imports rebounded strongly and surpassed pre-COVID levels during the current financial year.
  • There was significant pickup in net services with both receipts and payments crossing the pre-pandemic levels, despite weak tourism revenues.
  • Net capital flows were higher at US$ 65.6 billion in the first half of 2021-22, on account of continued inflow of foreign investment, revival in net external commercial borrowings, higher banking capital and additional special drawing rights (SDR) allocation.
  • India’s external debt rose to US $ 593.1 billion at end-September 2021, from US $ 556.8 billion a year earlier, reflecting additional SDR allocation by IMF, coupled with higher commercial borrowings.
  • Foreign Exchange Reserves crossed US$ 600 billion in the first half of 2021-22 and touched US $ 633.6 billion as of December 31, 2021.
  • As of end-November 2021, India was the fourth largest forex reserves holder in the world after China, Japan and Switzerland.

Monetary Management and Financial Intermediation:

  • The liquidity in the system remained in surplus.
    • Repo rate was maintained at 4 per cent in 2021-22.
    • RBI undertook various measures such as G-Sec Acquisition Programme and Special Long-Term Repo Operations to provide further liquidity.
  • The economic shock of the pandemic has been weathered well by the commercial banking system:
    • YoY Bank credit growth accelerated gradually in 2021-22 from 5.3 per cent in April 2021 to 9.2 per cent as on 31st December 2021.
    • The Gross Non-Performing Advances ratio of Scheduled Commercial Banks (SCBs) declined from 11.2 per cent at the end of 2017-18 to 6.9 per cent at the end of September, 2021.
    • Net Non-Performing Advances ratio declined from 6 percent to 2.2 per cent during the same period.
    • Capital to risk-weighted asset ratio of SCBs continued to increase from 13 per cent in 2013-14 to 16.54 per cent at the end of September 2021.
    • The Return on Assets and Return on Equity for Public Sector Banks continued to be positive for the period ending September 2021.
  • Exceptional year for the capital markets:
    • Rs. 89,066 crore was raised via 75 Initial Public Offering (IPO) issues in April-November 2021, which is much higher than in any year in the last decade.
    • Sensex and Nifty scaled up to touch peak at 61,766 and 18,477 on October 18, 2021.
    • Among major emerging market economies, Indian markets outperformed peers in April-December 2021.

Prices and Inflation:

  • The average headline CPI-Combined inflation moderated to 5.2 per cent in 2021-22 (April-December) from 6.6 per cent in the corresponding period of 2020-21.
    • The decline in retail inflation was led by easing of food inflation.
    • Food inflation averaged at a low of 2.9 per cent in 2021-22 (April to December) as against 9.1 per cent in the corresponding period last year.
    • Effective supply-side management kept prices of most essential commodities under control during the year.
    • Proactive measures were taken to contain the price rise in pulses and edible oils.
    • Reduction in central excise and subsequent cuts in Value Added Tax by most States helped ease petrol and diesel prices.
  • Wholesale inflation based on Wholesale Price Index (WPI) rose to 12.5 per cent during 2021-22 (April to December).
    •  This has been attributed to:
      • Low base in the previous year,
      • Pick-up in economic activity,
      • Sharp increase in international prices of crude oil and other imported inputs, and
      • High freight costs.
  • Divergence between CPI-C and WPI Inflation:
    • The divergence peaked to 9.6 percentage points in May 2020.
    • However, this year there was a reversal in divergence with retail inflation falling below wholesale inflation by 8.0 percentage points in December 2021.
    • This divergence can be explained by factors such as:
      • Variations due to base effect,
      • Difference in scope and coverage of the two indices,
      • Price collections,
      • Items covered,
      • Difference in commodity weights, and
      • WPI being more sensitive to cost-push inflation led by imported inputs.
    • With the gradual waning of base effect in WPI, the divergence in CPI-C and WPI is also expected to narrow down.

Sustainable Development and Climate Change:

  • India’s overall score on the NITI Aayog SDG India Index and Dashboard improved to 66 in 2020-21 from 60 in 2019-20 and 57 in 2018-19.
  • Number of Front Runners (scoring 65-99) increased to 22 States and UTs in 2020-21 from 10 in 2019-20.
  • In North East India, 64 districts were Front Runners and 39 districts were Performers in the NITI Aayog North-Eastern Region District SDG Index 2021-22.
  • India has the tenth largest forest area in the world.
  • In 2020, India ranked third globally in increasing its forest area during 2010 to 2020.
  • In 2020, the forests covered 24% of India’s total geographical, accounting for 2% of the world’s total forest area.
  • In August 2021, the Plastic Waste Management Amendment Rules, 2021, was notified which is aimed at phasing out single use plastic by 2022.
  • Draft regulation on Extended Producer Responsibility for plastic packaging was notified.
  • The Compliance status of Grossly Polluting Industries (GPIs) located in the Ganga main stem and its tributaries improved from 39% in 2017 to 81% in 2020.
  • The consequent reduction in effluent discharge has been from 349.13 millions of litres per day (MLD) in 2017 to 280.20 MLD in 2020.
  • The Prime Minister, as a part of the national statement delivered at the 26th Conference of Parties (COP 26) in Glasgow in November 2021, announced ambitious targets to be achieved by 2030 to enable further reduction in emissions.
  • The need to start the one-word movement ‘LIFE’ (Lifestyle for Environment) urging mindful and deliberate utilization instead of mindless and destructive consumption was underlined.

Agriculture and Food Management:

  • The Agriculture sector experienced buoyant growth in past two years, accounting for a sizeable 18.8% (2021-22) in Gross Value Added (GVA) of the country registering a growth of 3.6% in 2020-21 and 3.9% in 2021-22.
  • Minimum Support Price (MSP) policy is being used to promote crop diversification.
  • Net receipts from crop production have increased by 22.6% in the latest Situation Assessment Survey (SAS) compared to SAS Report of 2014.
  • Allied sectors including animal husbandry, dairying and fisheries are steadily emerging to be high growth sectors and major drivers of overall growth in agriculture sector.
  • The Livestock sector has grown at a CAGR of 8.15% over the last five years ending 2019-20. It has been a stable source of income across groups of agricultural households accounting for about 15% of their average monthly income.
  • Government facilitates food processing through various measures of infrastructure development, subsidized transportation and support for formalization of micro food enterprises.
  • India runs one of the largest food management programmes in the world.
  • Government has further extended the coverage of food security network through schemes like PM Gareeb Kalyan Yojana (PMGKY).

Industry and Infrastructure:

  • Index of Industrial Production (IIP) grew at 17.4 percent (YoY) during April-November 2021 as compared to (-)15.3 percent in April-November 2020.

· Capital expenditure for the Indian railways has increased to Rs. 155,181 crores in 2020-21 from an average annual of Rs. 45,980 crores during 2009-14 and it has been budgeted to further increase to Rs. 215,058 crores in 2021-22 – a five times increase in comparison to the 2014 level.

· Extent of road construction per day increased substantially in 2020-21 to 36.5 Kms per day from 28 Kms per day in 2019-20 – a rise of 30.4 percent.

· Net profit to sales ratio of large corporates reached an all-time high of 10.6 percent in in July-September quarter of 2021-22 despite the pandemic (RBI Study).

  • Introduction of Production Linked Incentive (PLI) scheme, major boost provided to infrastructure-both physical as well as digital, along with measures to reduce transaction costs and improve ease of doing business, would support the pace of recovery.

Services:

  • GVA of services crossed pre-pandemic level in July-September quarter of 2021-22; however, GVA of contact intensive sectors like trade, transport, etc. still remain below pre-pandemic level.

· Overall service Sector GVA is expected to grow by 8.2 percent in 2021-22.

· During April-December 2021, rail freight crossed its pre-pandemic level while air freight and port traffic almost reached their pre-pandemic levels, domestic air and rail passenger traffic are increasing gradually – shows impact of second wave was much more muted as compared to during first wave.

· During the first half of 2021-22, service sector received over US$ 16.7 billion FDI – accounting for almost 54 percent of total FDI inflows into India.

· IT-BPM services revenue reached US$ 194 billion in 2020-21, adding 1.38 lakh employees during the same period.

· Major government reforms include, removing telecom regulations in IT-BPO sector and opening up of space sector to private players.

· Services exports surpassed pre-pandemic level in January-March quarter of 2020-21 and grew by 21.6 percent in the first half of 2021-22 – strengthened by global demand for software and IT services exports.

· India has become 3rd largest start-up ecosystem in the world after US and China. Number of new recognized start-ups increased to over 14000 in 2021-22 from 733 in 2016-17.

· 44 Indian start-ups have achieved unicorn status in 2021 taking overall tally of unicorns to 83, most of which are in services sector.

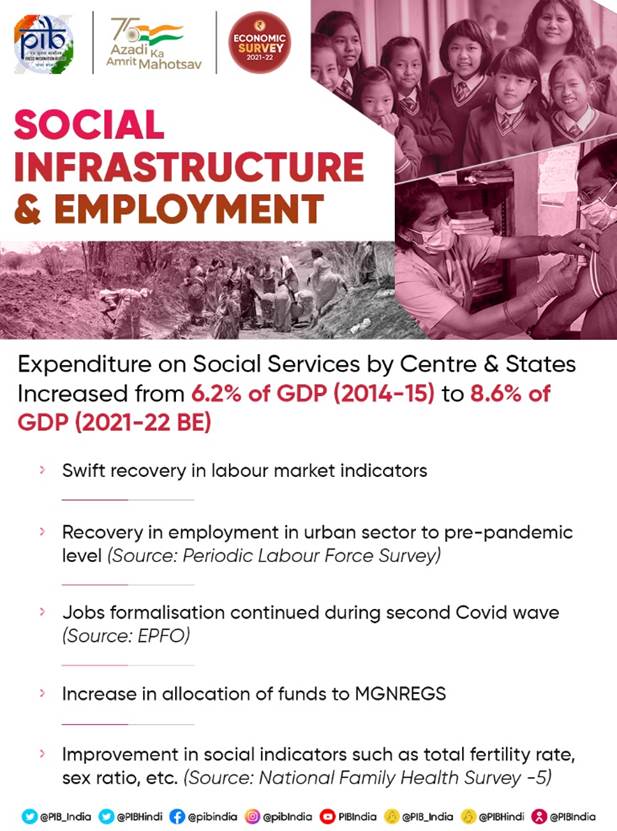
Social Infrastructure and Employment:

  • 157.94 crore doses of COVID-19 vaccines administered as on 16th January 2022; 91.39 crore first dose and  66.05 crore second dose.

· With revival of economy, employment indicators bounced back to pre-pandemic levels during last quarter of 2020-21.

· As per the quarterly Periodic Labour Force Survey (PFLS) data up to March 2021, employment in urban sector affected by pandemic has recovered almost to the pre-pandemic level.

· According to Employees Provident Fund Organisation (EPFO) data, formalization of jobs continued during second COVID wave; adverse impact of COVID on formalization of jobs much lower than during the first COVID wave.

· Expenditure on social services (health, education and others) by Centre and States as a proportion of GDP increased from 6.2 % in 2014-15 to 8.6% in 2021-22 (BE)

· As per the National Family Health Survey-5:

  • Total Fertility Rate (TFR) came down to 2 in 2019-21 from 2.2 in 2015-16
  • Infant Mortality Rate (IMR), under-five mortality rate and institutional births have improved in 2019-21 over year 2015-16

· Under Jal Jeevan Mission (JJM), 83 districts have become ‘Har Ghar Jal’ districts.

  • Increased allotment of funds to Mahatma Gandhi National Rural Employment Guarantee Scheme (MNREGS) to provide buffer for unorganized labour in rural areas during the pandemic.

RM/BY/MV/LP/RC/SSV/AKS/PB